Deniz Yeşil 1 , Bedrettin Özmen 2
Professional events are critical platforms for leveraging social opportunities to gain knowledge, share their experiences, socialize, observe and professional development (Li & Petrick, 2005). Competition and career advancement in the business world cannot be achieved only through developing professional skills; it also requires networking, sharing knowledge and experience. For this reason, people who aim to improve in the business world participate in the events that present these opportunities. Within the business world, which is developing quickly, these events offer possibilities for following innovations in the field and extending professional networks (Mitchel et al., 2016). People share their experiences, keep up with the innovations, and participate in activities, chase opportunities and interviews for new agreements (Severt et al., 2007; Yürük et al., 2017). The extent to which these events meet the attendees' expectations is important for the stakeholders since it is an indicator of the quality and success of the event. In the relevant literature, indicators such as service quality, value, satisfaction, loyalty, professional development and networking are used for this purpose (Jung & Tanford, 2017; Mitchell et al., 2016; Severt et al., 2007; Yürük et al., 2017). These indicators guide organizers in analyzing the level of expectations that are met and increasing the quality of activities. Also, the event's satisfaction boosts the chance to participate in future events. This study examines the intention to participate in professional meeting activities through the lens of attendee satisfaction. Specifically, it evaluates the impact of factors such as professional development, networking and event environment on satisfaction, aiming to contribute to both theory and practice based on its findings.
It is essential to understand the attendee behaviors and the effective structures involved in the decision-making process to ensure that activities such as information sharing, networking and promotion continue to thrive (Severt et al., 2007). Given the significance of attendee satisfaction, researchers should investigate and comprehend the complex and multifaceted constructs through which attendees assess the performance of an event and formulate their intentions to participate (Oliver, 2014). Researchers evaluate this topic from the perspective of economic, technical, service and social benefits (Mitchell et al., 2016). In the context of a commercial product, economic, technical and service benefits are at the forefront (Ravald & Grönroos, 1996). However, in events where professionals convene, the social benefits derived from relationships and interactions, such as networking, learning and sharing experiences, become paramount.
Anderson et al. (1994) define satisfaction as "overall evaluation based on the total purchase and consumption experience with a good or service over time." On the other hand, Oliver (2014, p. 8) characterizes satisfactions the judgment regarding contentment derived from consumption of a product/service or one of its features. In other words, satisfaction can be assessed by evaluating the discrepancy between an individual's expectations for the product or service and their actual experience. Attendee satisfaction serves not only a personal evaluation but also an indicator of the quality and success of events (Jung & Tanford, 2017; Severt et al., 2007). In the context of events, satisfaction should be assessed based on the range of services provided. To which extent services meet expectations is a critical determinant of satisfaction. Furthermore, the perception of services and attendees' experiences plays an important role in overall satisfaction (Koo et al., 2014).
Studies demonstrate that attendee satisfaction is influenced by various factors, including as networking, professional development, location and educational opportunities (Aktaş & Demiral, 2019; Jung & Tanford, 2017; Kırant Yozcu et al., 2022; Kim et al., 2009; Mair & Thompson, 2009; Pavluković & Cimbaljević, 2020; Severt et al., 2007). Severt et al. (2007) showed that activities and opportunities, networking, convenience of conference, education benefits, products and deals significantly impact event participation, educational opportunities affect satisfaction and satisfaction affects intention. Similarly, Mair and Thompson (2009) determined that the satisfaction of attending a conference can be addressed in six dimensions: networking, personal/professional development, cost, location, time and convenience, convenience and safety, respectively. In their regression analysis, Kim et al. (2009) showed that satisfaction affects intention. Aktaş and Demirel (2019), in their study conducted with academicians on the expectations and needs of attendees regarding conference participation, determined that academic development, networking, organizational problems and finally, location and social aspects are effective factors in decision-making, respectively. Similarly, Pavluković and Cimbaljević (2020), who conducted a study with academicians, showed that destination stimuli, costs and destination accessibility, educational and professional opportunities, intervening opportunities, location factors and conference factors play a role in event participation. Jung and Tanford (2017), in their meta-analysis study examining the factors affecting congress attendee satisfaction and ensuring repeated participation, determined networking and education constructs as the two most important factors that create satisfaction. Kırant Yozcu et al. (2022) showed that program content, personal/ professional development, networking, activities and perceived usefulness are effective on satisfaction except for activity and personal/professional development.
Intention to participate is a key determinant of the sustainability of the events. Acceptance theories elucidate the intention to engage in a behavior through three primary factors: attitude toward the behavior, social norms and perceived behavioral control (Venkatesh et al., 2003). These theories define intention as a conscious inclination to perform a specific behavior. Intention to participate, also referred to as behavioral intention, can be characterized as the likelihood of revisiting or recommending an event (Tavitiyaman & Qu, 2013). Research has explored this concept using terms such as “attitudinal loyalty” (Lee & Black, 2007), “future intention” (Hahm et al., 2016) and “behavioral intention” (Jung, 2005). In this context, satisfaction emerges as a significant predictor that enables individuals to cultivate positive emotions based on their past experiences, thereby enhancing their intention to participate in future events (Halim & Mokhtar, 2016; Severt et al., 2007; Tanford et al., 2012). Satisfaction not only motivates attendees to re-engage with in the event but also fosters a positive inclination to recommend the event to others and share their (Borges et al., 2021).
This study examines the construct of through three essential dimensions: professional development, networking and event environment. Each of these dimensions is elaborated upon in the following headings.
The attendees' goals are to access information and experiences that contribute to their professional development and to engage in a social environment (Mitchell et al., 2016). Such events provide attendees with access to shared information and the opportunity to exchange their experiences. Attendees benefit from various learning and interaction opportunities through the events' workshops, panels and networking meetings. The motivation for personal development and skill acquisition in people encourages individuals to participate in these events (Butler, 1999; Kim et al., 2012). This phenomenon, also conceptualized as learning value, is defined as the desire of attendees to discover what other individuals or institutions do differently and more effectively than what is already known (Mitchell et al., 2016). Jung and Tanford (2017) revealed that the professional development and educational opportunities offered at events are significant factors influencing attendee satisfaction and promoting repeated participation. Rittichainuwat et al. (2001) and Aktaş and Demirel (2019) emphasized in their research that educational opportunities are the most critical factors critical factor motivating attendees to participate in conferences. . The extent to which individuals feel that they have achieved professional development in the event directly influences their perception of the value of the event and their intention to participate in the future events (Kim et al., 2012).
One of the most fundamental values of events such as forums, congresses and symposiums is socialization (Sheth et al., 1991). Individuals are inherently curious about the social status, cultural structures and business conditions of those with whom interact in a professional context this information encompasses crucial procedural insights regarding business practices that will facilitate healthier communication and cooperation with partners ultimately benefiting their respective business environments (Mitchell et al., 2016). Within the framework established by Oppermann and Chon (1997), networking emerges as a significant element among the "association/conference factors. Similarly, Rittichainuwat et al. (2001) discussed networking s a key motivator for conference participation, ranking it second in terms of motivation. Networking is an interaction component that includes opportunities to communicate with individuals both professionally and personally, fostering a sense of community and enabling the establishment of new connections (Yoo & Zhao, 2010). As social beings, individuals participate in professional events in order to forge social connections, enhance their social standing and to strengthen their relationships (Mitchell et al., 2016). Networking and a sense of community at these events are important predictors of satisfaction and intention to participate (Hahm et al., 2016; Kim et al., 2012). Jung and Tanford (2017) revealed that networking opportunities significantly influence event satisfaction. In numerous studies, attendees have identified networking as the primary reason for attending events (Jung & Tanford, 2017; Tanford et al., 2012; Yoo & Zhao, 2010). Kim et al. (2012) found that the availability of networking is a determining factor in the intention to participate in future events. In this study, considering these factors, the networking dimension was included in the research model and evaluated as a component of satisfaction.
The event environment is a crucial component of attendee satisfaction encompassing factors such as accessibility, transportation, timing, atmosphere and services (Jung & Tanford, 2017). Research by Lu and Cai (2011) indicated that the overall image of the environment in which the event takes place significantly influences the attendees’ general satisfaction and their intentions to participate in future events. The event environment can be understood as a framework in which both the services provided inside and the overall setting are assessed in terms of geography and accessibility. The environment's safety, air conditioning, suitability of the environment for the event and refreshments can be considered indicators for evaluating the services offered inside. Ease of access to the venue and tourism opportunities serve as important external indicators. On the other hand, Jung and Tandford (2017) determined in their research, which examined existing studies in the literature that the convention environment has a significant impact on the attendees’ commitment and in intentions to re-participate. Similarly, Pavluković and Cimbaljević (2020) also revealed in their research that factors related to the conference environment, such as the location of the congress and its accessibility, play a crucial role in intention to participate and overall satisfaction. Siu et al. (2012) found that the environmental conditions and the convention climate influences the attendees’ satisfaction utilizing an extended version of Bitner's service scape model. López-Bonilla et al. (2022) identified destination and leisure as the most important motivational factors in congress events. Although the event environment is a key component influencing satisfaction, its effect is relatively minor compared to other factors (Aktaş & Demirel, 2019). In summary, the environments in which events are held play a crucial role in influencing attendee satisfaction and their intention to participate again the literature reviews indicate that professional events provide the attendees with significant social and professional benefits, which greatly impact the relationship between satisfaction and participation intention. The satisfaction attendees derive from an event not only influences their decisions to re-participate but also affects their likelihood of recommending the event to others and sharing their experiences.
In this context, understanding how various dimensions of satisfaction affect participation intention is critical for the future success of these events. This study aims to explore the effect of satisfaction on participation intention in a professional event and to examine the relationships between these two constructs in detail. To achieve this, a valid and reliable measurement tool was first developed to assess attendee satisfaction. Subsequently, the relationships between satisfaction and participation intention were analyzed and summarized within the framework of a model.
This research is a correlational study designed to examine the predictive relationships among the constructs discussed in accordance with the established research objectives. Correlational research aims to elucidate the nature of the relationships between variables and assess the potential of one variable to predict another based on these relationships. Predictive correlational studies to forecast the outcomes of one variable based on the values of another, in alignment with the patterns identified between the variables (Frankel, 2012). This type of design provides a solid foundation basis for understanding the interaction between satisfaction and participation intention, as well as for exploring how these constructs influence each other in greater depth.
The study group for this research comprises of 415 individuals who responded positively to a survey invitation sent to attendees of a forum event focused on human resources, which was attended by over 3,000 professional. Following the forum event, the attendees received an online invitation to fill out the data collection tool. In response, 234 (56.4%) males and 181 (43.6%) females completed tool. Examining the age distribution of the attendees, 62 (14.94%) individuals are aged 20-29, 174 (14.94%) people are aged 30-39 (41.93%), 115 (27.71%) people are aged 40-49, 52 (12.53%) people are aged 50-59 and 12 (2.89%) people are over the age of 59. Regarding the sectors represented by the attendees, 44.58% are representatives of public institutions, 36.63% are representatives of universities, 17.35% are private sector employees, 0.96% are students and 0.48% are from other sectors.
The research data was collected through an online survey accessed via a link sent to the attendees via email. The data collection instrument consists of two parts. The first part gathers demographic information such as gender, age, sector of employment, while the second part comprises of 18 items designed to assess attendee satisfaction and participation intention. The researchers developed the "Event Participation Satisfaction Scale" in the second part. In the scale development phase, the existing tools in the literature and the scope of the evet were taken into account. Consequently, exploratory factor analysis and confirmatory factor analysis were first conducted. The confirmatory factor analysis resulted in a tool consisting of 16 items categorized into three factors: professional development, networking and event environment. The scale employs a 5-point Likert format. Detailed evidence supporting the scale's validity is presented in the findings section of the study. Based on this evidence, the data collection instrument was deemed valid and reliable.
The analysis was conducted using exploratory factor analysis (EFA), Mahalanobis distance, hierarchical confirmatory factor analysis (HCFA), structural equation modeling and reliability analysis. First, EFA was performed to identify the factors within the measurement tool developed by the researchers. Second, 29 outliers were removed from the dataset using Mahalanobis distance. HCFA was employed to assess the reliability and validity of the tool. The effect of satisfaction on intention was analyzed through SEM. The ‘factanal’ function of the R programming language was utilized for EFA, while the ’lavaan’ library was used for SEM (Rosseel, 2012).
This section reports the main findings obtained from testing the validity and reliability of the data collection tool used in the research. Then, findings regarding the structural equation model showing the predictive relationship between satisfaction and participation intention are included.
EFA was employed to identify the underlying patterns and dimensions within the data. The Kaiser-Meyer-Olkin (KMO) Measure of Sampling Adequacy and Bartlett's Test of Sphericity were utilized to assess the suitability of the data for factor analysis. The results of Bartlett's Test of Sphericity (χ² = 3799.03, df = 136, p < .001) and the KMO value (0.91) indicated that factor analysis was appropriate. The Bartlett Test of Sphericity revealed a significant value of 3799.03 at a significant level of 0.000, confirming the presence of nonzero correlations among the variables. This finding supports the assumption of factor analysis, which necessitates a certain degree of multicollinearity among the variables. In the initial analysis, one item was removed due tı its factor loading being less than 0.40 (Hinkin 1998). This analysis was subsequently repeated. The results of the reanalysis indicated that dataset was appropriate for evaluation using exploratory factor analysis. Maximum likelihood estimation revealed the factor structure of the data and orthogonal rotation was enhanced to increase the interpretability of the factors. The findings indicated that the data comprised three factors and 16 items. These three factors accounted for 54.3% of the total variance. The factor loadings are presented in Table 1.
| Item No | Factor Loadings (1) | Factor Loadings (2) | Factor Loadings (3) | Eigenvalue | Variance Explained |
|---|---|---|---|---|---|
| m4 | 0.45 | 0.28 | 0.27 | ||
| m5 | 0.49 | 0.19 | 0.22 | ||
| m6 | 0.73 | 0.22 | 0.18 | 4.186 | 26.2% |
| m7 | 0.70 | 0.28 | 0.24 | ||
| ogrenme1 | 0.55 | 0.27 | 0.18 | ||
| ogrenme2 | 0.72 | 0.20 | 0.11 | ||
| ogrenme3 | 0.79 | 0.27 | 0.19 | ||
| ogrenme4 | 0.80 | 0.29 | 0.14 | ||
| m10 | 0.28 | 0.71 | 0.31 | 2.636 | 16.5% |
| network1 | 0.43 | 0.56 | 0.19 | ||
| network2 | 0.31 | 0.86 | 0.18 | ||
| network3 | 0.31 | 0.68 | 0.12 | ||
| m11 | 0.05 | 0.11 | 0.64 | 1.852 | 11.6% |
| m12 | 0.15 | 0.10 | 0.67 | ||
| m13 | 0.29 | 0.25 | 0.50 | ||
| m14 | 0.23 | 0.13 | 0.51 | ||
| Total | 54.3% |
The first factor is called "professional development," and it contains items like "contributing knowledge in the HR field" and "having knowledge about current HR practices." Networking is the second factor, which consists of items like "suitable for networking" and "meeting up with professionals in the field". The third factor is named "event environment," and it consists of questions about the characteristics of the event environment.
In this research, the satisfaction factor for the event was examined across three fundamental dimensions: professional development, networking and event environment. These three latent variables were evaluated using confirmatory factor analysis on 16 indicator variables. The error and fit indices (χ²/df, RMSEA, GFI, CFI and NFI) obtained from the confirmatory factor analysis, conducted after necessary adjustments, are presented in Table 2.
| χ2/sd | RMSEA | GFI | CFI | NFI | |
|---|---|---|---|---|---|
| (<3.0) | (<0.08) | (>0.90) | (>0.90) | (>0.90) | |
| Before Modification | 4.4 | 0.094 | 0.869 | 0.896 | 0.870 |
| Last Model | 2.94 | 0.071 | 0.907 | 0.941 | 0.914 |
The error and fit indices presented Table 2 did not fall within the desired value range. The final model's error and fit indices (χ²/df = 2.94, RMSEA = 0.071, GFI = 0.907, CFI = 0.941, NFI = 0.914) were obtained after correlating the errors between the sixth and seventh items, as recommended by the software. The error and fit indices for the 16-item scale were found to meet with the specified criteria: the χ2/df value being below 3, the RMSEA value being below .08 and the GFI, CFI and NFI values exceeding 0.90, which are recognized in the literature as indicators of a good model-data fit (Schermelleh-Engel, Moosbrugger & Müller, 2003). Consequently, the model demonstrated a good fit with the data. The standardized factor loadings are illustrated in Figure 1.
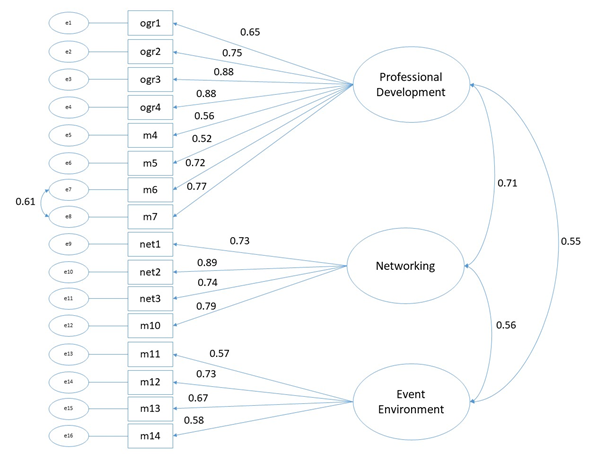
All item factor loadings were greater than 0.50 (see Figure 1). Each item loaded significantly only on the factor to which it was assigned. The correlations between factors ranged from low to medium, demonstrating a structure that aligns with the independence assumption. To assess internal consistency, both Cronbach’s alpha and McDonald's omega were calculated and the resulting values are presented in Table 3.
| Cronbach Alpha | McDonald’s Omega | |
|---|---|---|
| Professional Development | 0.90 | 0.90 |
| Networking | 0.86 | 0.87 |
| Event Environment | 0.73 | 0.73 |
The coefficients in Table 3, which exceed 0.70, indicate that the measurement results are reliable (Nunnally & Bernstein, 1994). To assess the construct validity of the measurement tool, both convergent and divergent validity were examined. For convergent validity, we evaluated whether the factor loadings were greater than 0.50 and whether the average explained variance values of the factors also exceeded 0.50 (Fornell & Larcker, 1981). The findings are summarized in Table 4.
| AVE | Professional Development | Networking | Event Environment | |
|---|---|---|---|---|
| Professional Development | 0.53 | 0.73 | ||
| Networking | 0.63 | 0.68 | 0.79 | |
| Event Environment | 0.41 | 0.55 | 0.58 | 0.64 |
Table 4 indicates that the Average Variance Extracted (AVE) values exceed 0.50 for the constructs of professional development and networking, while the value for the activity environment is below 0.50. Consequently, convergent validity is deemed at the acceptable level for the professional development and networking constructs. Discriminant validity was assessed by comparing the correlations between constructs with the square root of their respective AVE values. According to Fornell and Larcker (1981), the correlations between constructs should not exceed the square root of the AVE. As shown in Table 4, the square root of the AVE is greater than the correlations between the constructs, thereby establishing discriminant validity for professional development, networking and activity environment. Fornell and Larcker (1981) also noted that AVE serves as a conservative estimate and convergent validity may still be accepted even if it falls below 0.50, provided that construct reliability is satisfactory. Internal reliability is confirmed based on the findings related to structural reliability.
The results first-order Confirmatory Factor Analysis (CFA) results provided structural evidence that the items in the data collection instrument are appropriately categorized under specific satisfaction factors. Following this, a second-order CFA was conducted to examine and confirm whether the first-order constructs operate as dimensions of a broader higher-order construct.
The goodness-of-fit indices for the second-order confirmatory factor analysis (CFA) are presented in Table 5. This analysis was conducted to examine the latent variables of professional development, networking and event environment under common higher-level factors.
| χ²/sd (<3.0) | RMSEA (<0.08) | GFI (>0.90) | CFI (>0.90) | NFI (>0.90) | |
|---|---|---|---|---|---|
| Last Model | 2.94 | 0.071 | 0.907 | 0.941 | 0.914 |
As shown in Table 5, the goodness-of-fit values fall within the acceptable ranges (χ²/df = 2.94, RMSEA = 0.071, GFI = 0.907, CFI = 0.941, NFI = 0.914). Based on these results, it can be concluded that the three structures discussed can be categorized under an exponential variable referred to as satisfaction. The model developed for this purpose is illustrated in Figure 2.
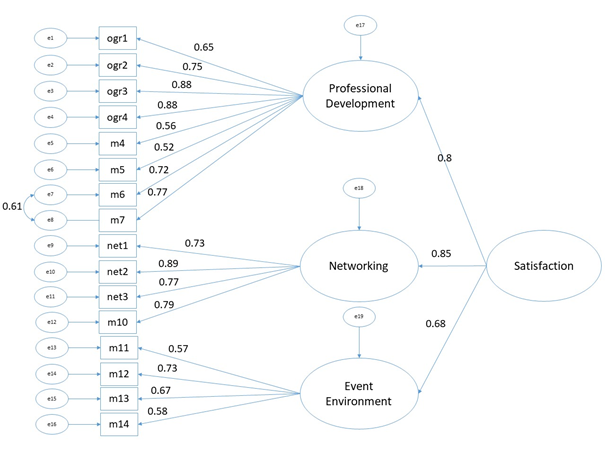
As a result of second-order CFA, all factorial relationships between satisfaction and networking, professional development and activity environment structures were significant (p<0.05). When the sizes of the factor loadings were evaluated, it was seen that the structures were listed under satisfaction as networking, professional development and activity environment.
SEM was used to examine the effect of satisfaction on intention to participate in an event. The goodness-of-fit model is given in Table 6.
| χ²/sd (<3.0) | RMSEA (<0.08) | GFI (>0.90) | CFI (>0.90) | NFI (>0.90) | |
|---|---|---|---|---|---|
| Before Modification | 3.01 | 0.072 | 0.901 | 0.934 | 0.905 |
| Last Model | 2.74 | 0.067 | 0.910 | 0.944 | 0.915 |
When the final model's goodness of fit values (χ2/sd = 2.74, RMSEA = 0.067, GFI = 0.910, CFI = 0.944, NFI = 0.915) align with the demanded criteria. The obtained results revealed that the general fit indices of the model were a good fit. The obtained structural model is given in Figure 3.
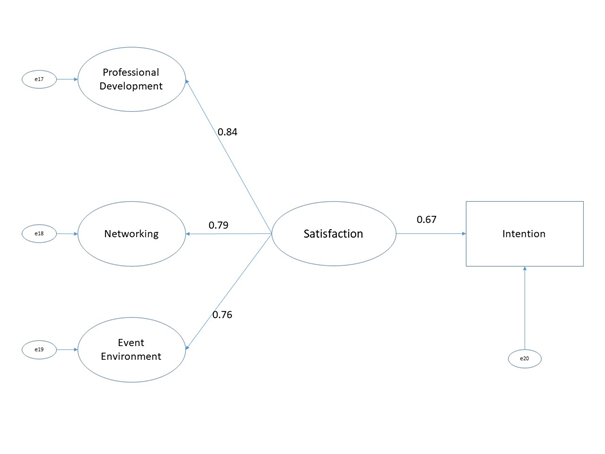
Specifically, three dimensions of satisfaction—professional development, networking and event environment—were found to have significant positive effects on the intention to participate (β = 0.67, p < 0.001). These results indicate that satisfaction serves as a predictor of the intention to participate, underscoring its critical role in effective event planning. Notably, the satisfaction construct accounts for 45% of the variance in intentions to participate in events.
This study has two primary objectives: (1) to develop a reliable and valid scale for measuring satisfaction with events and (2) to examine the impact of satisfaction on intention using the scale developed by the researchers through Structural Equation Modeling (SEM). Confirmatory Factor Analysis (CFA) validated the three dimensions of satisfaction. The analyses revealed that attendee satisfaction comprises the constructs of networking, professional development and event environment. SEM indicated that the higher-order factor encompassing these constructs predicted the intention to participate. The results are discussed in the context of the relevant literature.
In this study, networking was identified as the most crucial component of satisfaction. While networking events offer opportunities for learning and specializing, they also foster social, emotional and hedonic values for attendees (Mitchell et al., 2016). Jung and Tanford (2017) indicated that networking is the primary factor influencing satisfaction and loyalty in their meta-analysis of event studies. For business environments where time is of the essence, these events create conducive settings for professional development and networking (Kırant Yozcu et al., 2022; Yoo & Chon, 2008). Yoo and Zhao (2010) found that networking emerged as the most significant predictor of the intention to participate. Socialization experiences, particularly in promotional events, were highlighted as the key component of satisfaction (Rashid et al., 2020). Mair and Thompson (2009) noted that among six factors, only networking and cost significantly affected participation. Consistent with the findings and existing literature, networking opportunities not only enhance satisfaction levels but also demonstrate a substantial impact on the intention to participate.
The second most significant factor is professional development. Studies examining the relationship between professional development and satisfaction yield varying results regarding their order of importance (Aktaş & Demirel, 2019; Jung & Tanford, 2017; Mair & Thompson, 2009). For instance, a meta-analysis identified education as the second most crucial factor, aligning with our findings (Jung & Tanford, 2017). When analyzing events in which academics participate, academic development emerges as the most critical factor (Aktaş & Demirel, 2019). Pavluković and Cimbaljević (2020), who reached similar conclusions, demonstrated that educational and professional opportunities significantly influnce both attendee satisfaction and the intention to participate in future events. Severt et al. (2007) stated that educational activities at exhibitions are the primary factor that encourages attendees to participate in events. Research findings indicate that professional development is a vital predictor of satisfaction and the intention to participate. The literature emphasizes that professional and educational opportunities strongly impact attendee satisfaction and the intention to engage in future events (Jung & Tanford, 2017; Pavluković & Cimbaljević, 2020; Severt et al., 2007).
The event environment emerged as the third most significant factor influencing participant satisfaction. This evaluation encompasses aspects such as accessibility, venue layout, signage and catering services. The location of the conference plays a crucial role in the decision-making process (Pavluković & Cimbaljević, 2020; Severt et al., 2007; Yoo & Zhao, 2010). While the event environment ranks as the third most important factor in this study, López-Bonilla et al. (2022) identified destination and leisure as the primary motivators for participation. Supporting these findings, Aktaş and Demirel (2019) noted that although the event environment contributes to overall satisfaction, its impact is relatively low compared to other factors. Despite being classified as a component of satisfaction with minimal influence in the current research, the quality of services provided and the environmental structures are vital for fostering attendee loyalty (Jung & Tanford, 2017).
Satisfaction, along with its sub-constructs—networking, professional development and event environment—holistically influences participation intentions. Research indicates that satisfaction is a strong predictor of the intention to participate, as it enhances positive attitudes toward attendees' experiences (Halim & Mokhtar, 2016). Furthermore, satisfaction can forecast the intention to engage in future events (Kim et al., 2012). Notably, satisfaction not only increases the likelihood of participating in future events but also encourages individuals to recommend these events to others (Borges et al., 2021).
This situation aligns with the fundamental components of acceptance theories, including social norms and individual attitudes that influence participation intentions (Venkatesh et al., 2003). In a meta-analysis conducted by Jung and Tanford (2017), a significant relationship was identified between satisfaction and commitment. Similarly, the findings of other studies corroborate this research, indicating that satisfaction impacts re-participation intentions and loyalty (Tanford et al., 2012; Severt et al., 2007; Sung & Lee, 2015). Kırant Yozcu et al. (2022) demonstrated that satisfaction influences participation intentions, or commitment, in virtual events that have gained popularity following the COVID-19 pandemic. Despite these evolving circumstances, it is clear that satisfaction remains a crucial determinant in the sustainability of such events.
The satisfaction structures examined in this study are limited to professional development, networking and event environment factors. Notably, variables such as cost and value, which are frequently highlighted in the literature, were excluded from the study's scope. This exclusion is due to the fact that no registration fee was charged to attendees for participation in the event; all expenses were covered by the organizing and stakeholder organizations. For events targeting different audiences and purposes, comprehensive studies could be conducted that take into account these important variables. Additionally, the final behavioral indicator in this study was measured using the intention variable. Future research could focus on measuring actual participation behavior in the following year to assess the realization of intention. Data were also collected from attendees from other countries during the research process. However, due to insufficient data for conducting structural analyses, these participants were not included in the analyses. The descriptive analyses performed on the available data indicate that the overall satisfaction of attendees at international events is at a reasonable level, consistent with existing literature.
No financial support was obtained for this research from any public, private, or institutional funds.
The data supporting this study are not publicly available due to privacy and confidentiality restrictions.
The authors declare that they have no competing interests related to this research.